Enterprise Communication Analysis
Catch the wind of change with GraphlyticWe are overwhelmed by data of any kind. We try to leverage them, more or less successfully. Smaller companies strive to operate data in Excel sheets or in any cloud-based application. Larger companies store data in warehouses and data are presented in the form of reports with tables and graphs. With growing amounts of data, the phenomenon of relationship data arises. So, what if we need not only data structured in the tables, but we wish to work with many relationships between single data elements?
As you may guess, the graph visualization is the answer :)
And, what if we say we can transfer the existing company data elements into relationship data that can bring unexpected results to manage the organization in a smarter way?
How to do it?
We will look at overall company communication - to bring new findings. We will use enterprise communication data to examine the behavior of the employees, and the company as a living unit. We can use any kind of communication events such as call logs, e-mails, company chat or social media tool logs, as well as company phone and e-mail books. These events could be enriched with data from any company tool as CRM, ERP etc. There is a general rule for graphs – the more data we use, the more visible and easier to identify behavior patterns are. Having this prepared in a tailored data model we will follow the patterns of collaboration among employees and the teams in the graph visualization solution Graphlytic. And, as with any live element, we start to observe that behavior changes in time - we will use the timeline filter slider for that. Not only this, we will measure the communication from the beginning which will allow us to see and manage trends of collaboration.
This way we can find informal leaders, the talents, or the connectors of teams. By changing the collaboration patterns, we can easily unveil potential problems within organizations or among single units. By having this ability, we can influence and intentionally change and improve collaboration patterns to improve the overall company results.
To start with the basics, let us visualize a simple example of phone calls communication among four employees within a given period. The graph visualization below is composed of employees (‘nodes’ in graph terminology) and arrows representing a certain amount of calls (which is defining the ‘relationship’) between them. The direction of the arrows describes the direction of communication. The thicker and more of a red color the arrow is, the higher was the intensity of the communication. Having it weighted using clustering coefficients, for example, allows us to set a bottom line for measuring and evaluating development of the collaboration.
Core concept of enterprise communication visualization
Now, what if we apply this approach on a larger scale – real enterprise – and will focus on overall communication patterns and trends? Can we look upon it as a social network? Yes, we definitely can. In the picture below we can see an example of a small company or part of a corporation depicting graph visualization of communication between the departments. And the communication describes the collaboration perfectly.
After a short fine-tuning, we are able to see the dynamics of collaboration within each team – who is the heavy communicator; which team players act as a solid team connector; who are to improve; and what the trends are or how the organizational change influenced the behavior and collaboration within and among teams.
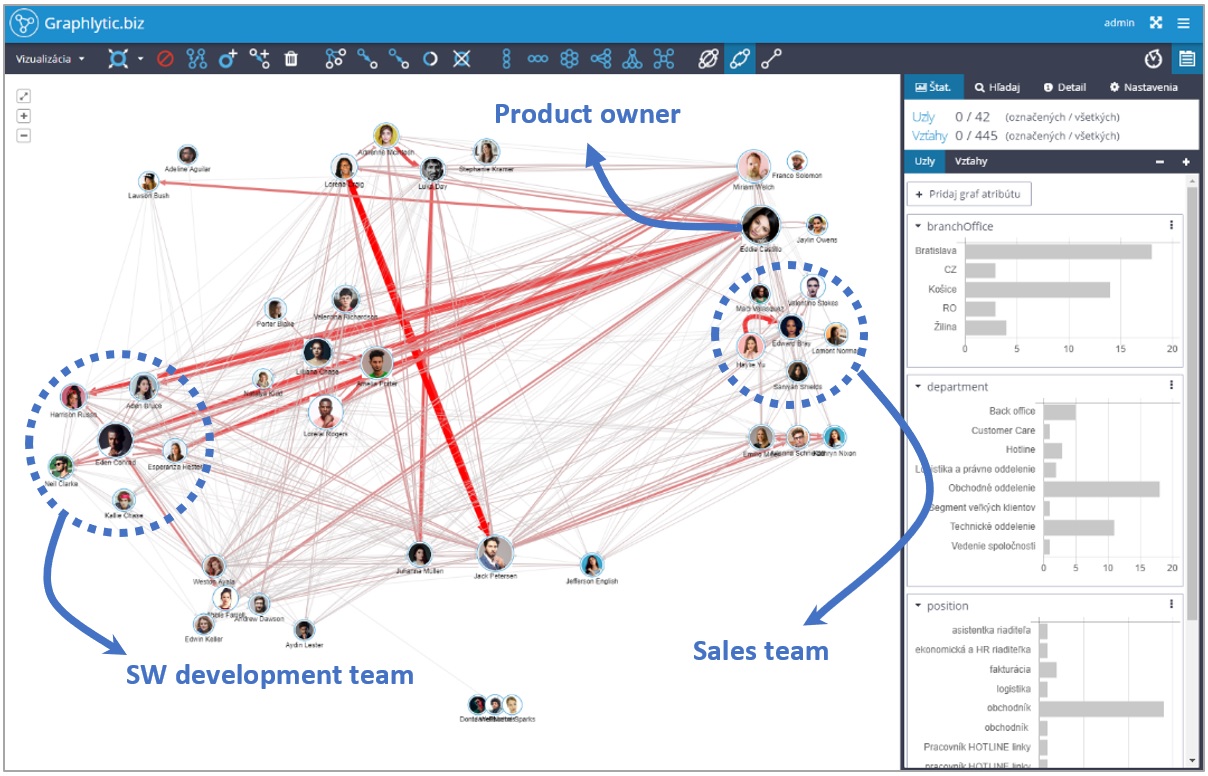
In this example we can see a heavy communication between the product owner and the SW development team. Is it strong enough? Does she communicate with the right positions within the SW development team? How did it change after the last organizational re-shuffle? Is the collaboration of the product owner sufficient with the sales team? This way we can go on in a limitless way to find potential bottlenecks or uncover the real rising stars in the company. So, jump in and simply follow the step-by-step improvement process based on previously unseen and unmeasured data.
Further reading
Summary
Pain points / Challenges
- Need to tune-up the performance of sales teams
- Bumpy or poorly functioning processes due to insufficient internal communication
- Sub-optimal collaboration in company or in teams
- Data overload in BI tools not covering relationships between data elements
- Organizational changes within the company influencing company outputs and need to monitor and manage these changes successfully
Solution
- Source data – any kind of events such as phone calls (internal phone book, contacts from CRM, ERP etc.), e-mail, messaging apps, etc.
- Using agreed data model
- Source data for any given time period transformed into graph NoSQL DB
- Transformed data imported into Graphlytic instance
- Visual analysis of communication patterns and changes in graph visualization
- One-pager and easy to understand outputs
Benefits
- Great help for understanding how collaboration works within the company
- Tangible inputs for communication improvements within the company or with the customers
- Tuned-up sales teams with optimal communication patterns toward end-customers or affiliates
- One-pager reports depicting dynamics of the communication within and among departments - overall communication survey
- Strong support for organizational changes within the company – detection of changes in behavior of employees
- Identification of informal team leaders or connectors visually in the graph visualization